Women resist and organize their own communities through care economies, protecting common goods and food sovereignty.
“To Whom Does the Earth Belong?”
1
2
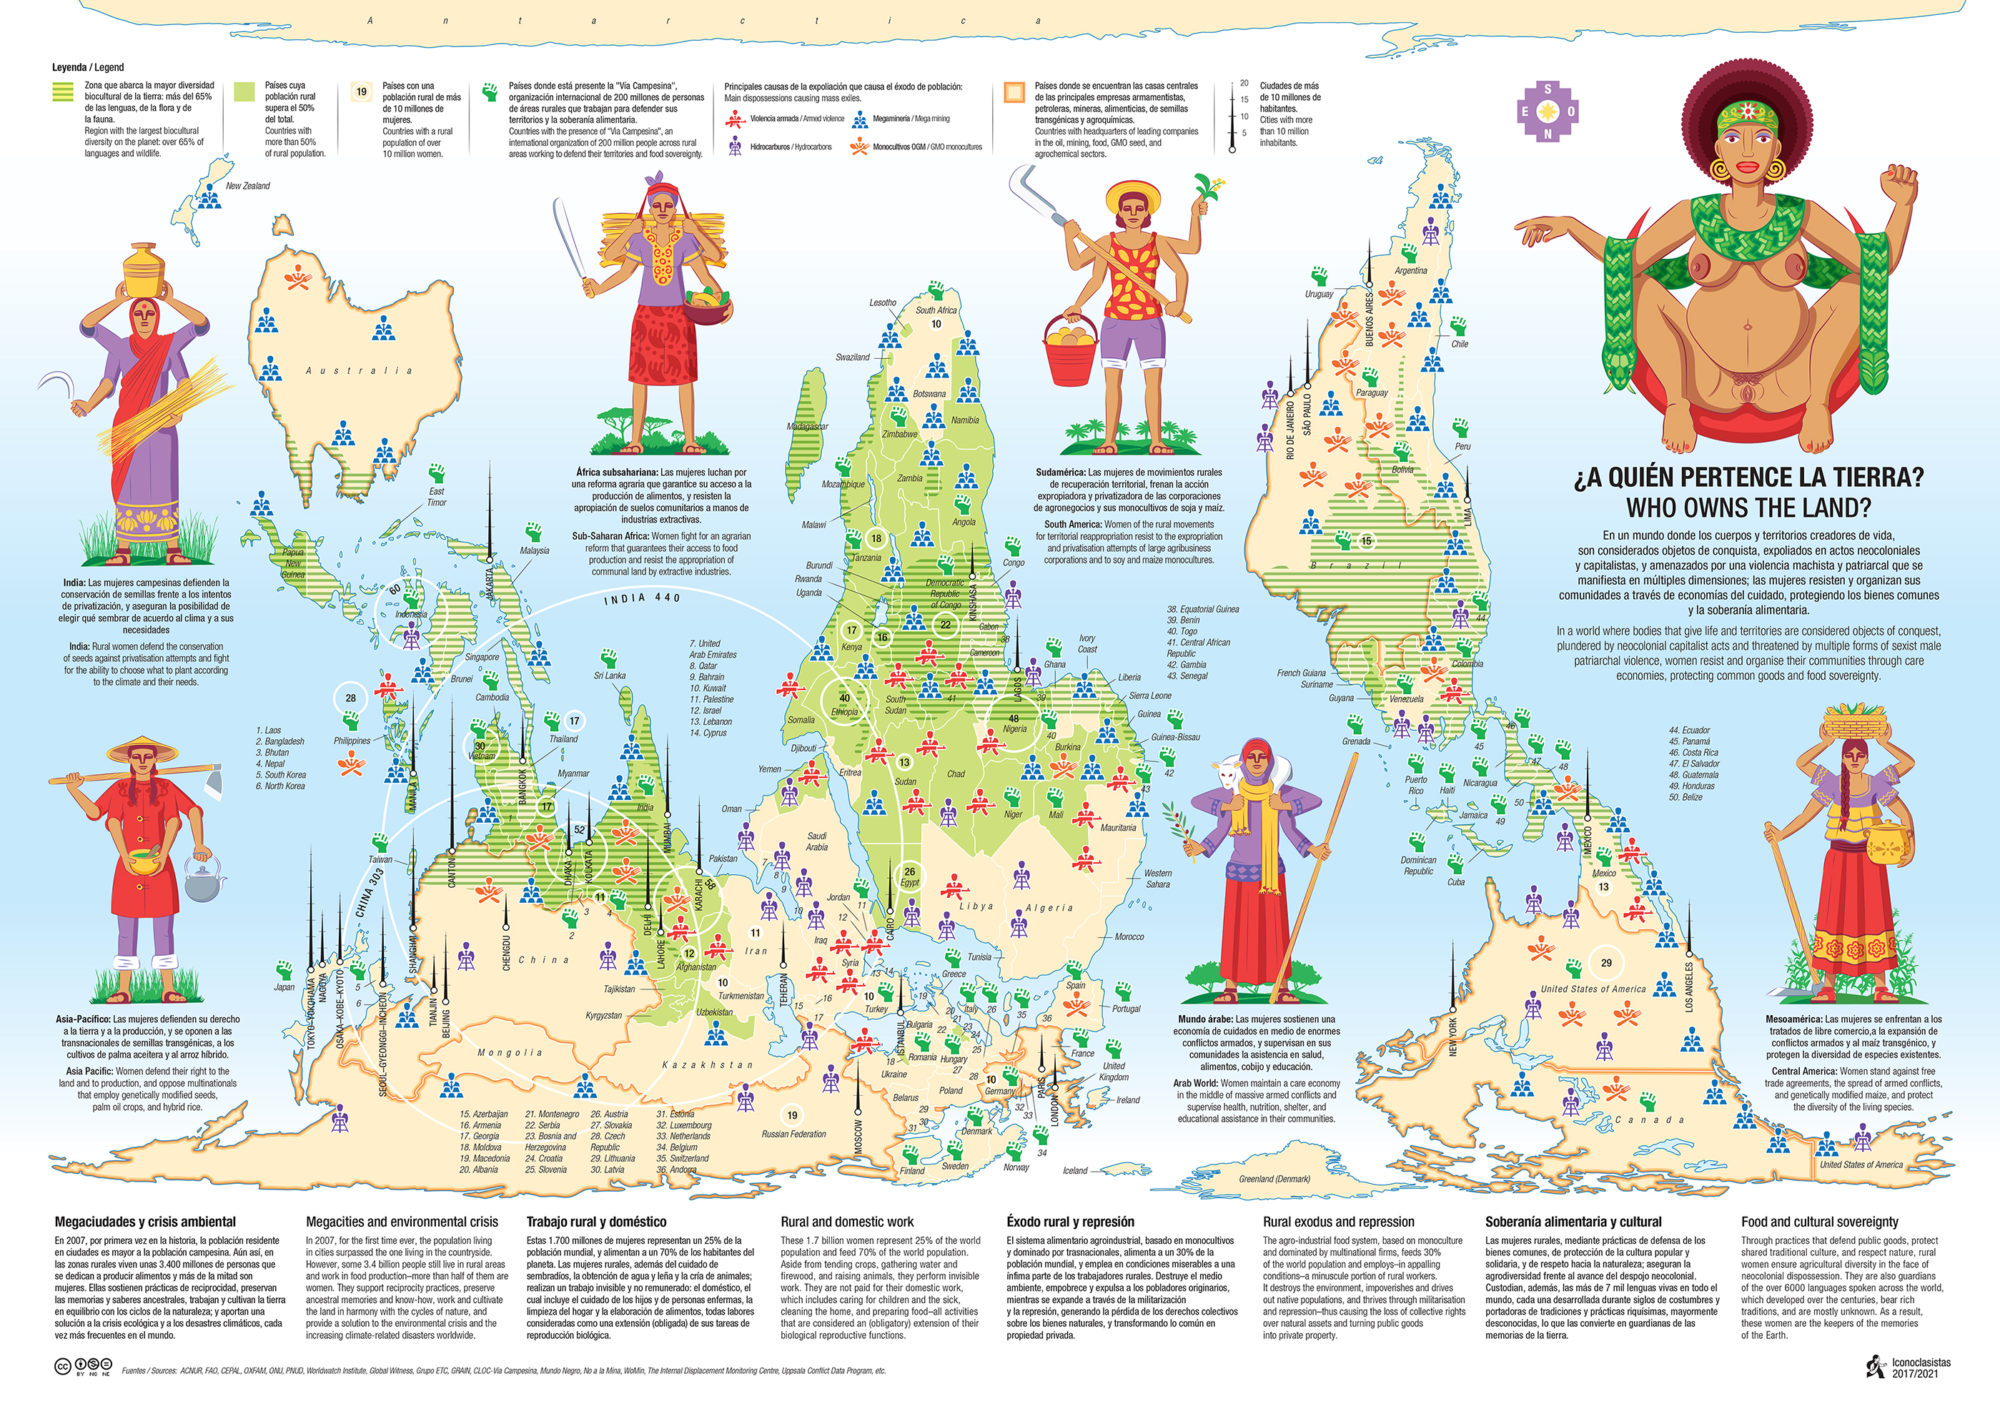
The legend identifies rural and Via Campesina countires, mass exile causes, countries with large corporations, and mega cities.
3
The base map correctly illustrates the relationships in size among the areas of the Earth.
Julia Risler and Pablo Arles, Iconoclasistas
This world map surveys the work of the 1.7 billion rural and farmer women around the world who, in addition to producing 70 percent of the food we eat, resist patriarchal violence and Western domination, and organize in their communities. The practices and knowledge that support the economies of care for these women, who in turn protect food sovereignty and public goods, are threatened by the agroindustrial food system’s extractive projects and by the violence that results from it—genocides, deportations, and wars.
The landforms are based on the Gall-Peters projection, a map of the world created in 1855 by James Gall and revisited in 1974 by Arno Peters. This representation (here with its poles inverted) correctly illustrates the relationships in size among the areas of the Earth—unlike the more common Mercator projection, in which territories are enlarged as they approach the poles.[1] The Gall-Peters projection gained a special relevance in the 1970s, when national liberation movements challenged the Western domination of the world, and in our work it plays both a geographic and a symbolic role. The atypical projection and the placement of south at the top of the map upend conventional presentations of the Earth, thus providing a fitting basis for a visualization that identifies the presence of farmers, rural majorities, and biocultural diversity, and that labels extractive projects and armed conflicts while also highlighting the efforts of women in defending the land.[2] Bilingual, in Spanish and English, the map is available for free download for domestic or communal use.
[1] The Mercator projection, developed in 1569 by the Flemish cartographer Gerardus Mercator and widely adopted for use in navigation, preserves the shapes of the Earth’s landforms but not their relative sizes. Size distortion increases toward the poles, so land masses in the far south and far north appear much larger than territories near the equator. For example, in the Mercator projection Greenland appears to be the same size as Africa, while in reality it is similar in size to the Democratic Republic of the Congo, which is just one of Africa’s more than sixty states and territories.
[2] The term “biocultural” describes and acknowledges the co-evolution and interdependence of biology and human culture. Biocultural diversity is a measure of the diversity of all life in a region, including human languages and cultures as well as plants and animals and their habitats and ecosystems.